
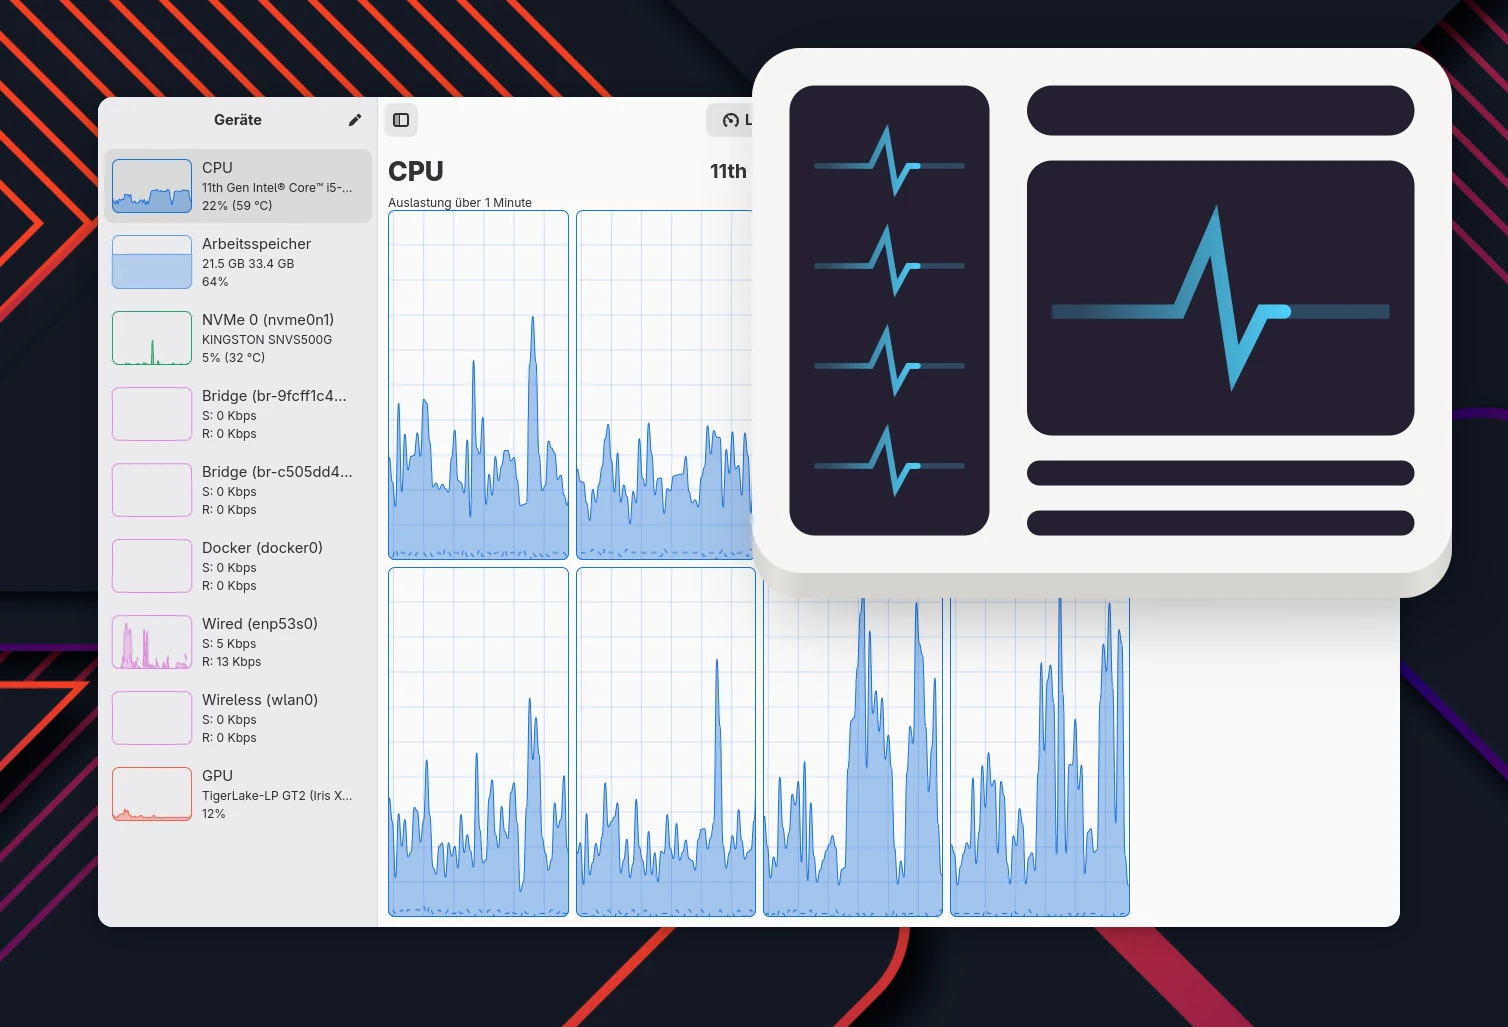
I’m always on the lookout for lean, functional tools that fit well into my preferred Linux desktop environment GNOME and, of course, rely on free software. Mission Center is exactly that: a full-featured monitoring tool with a modern Libadwaita design that presents system resources clearly. Like many young projects, it’s written in Rust. The newly released version 1.0 brings a whole list of changes.
What is Mission Center?
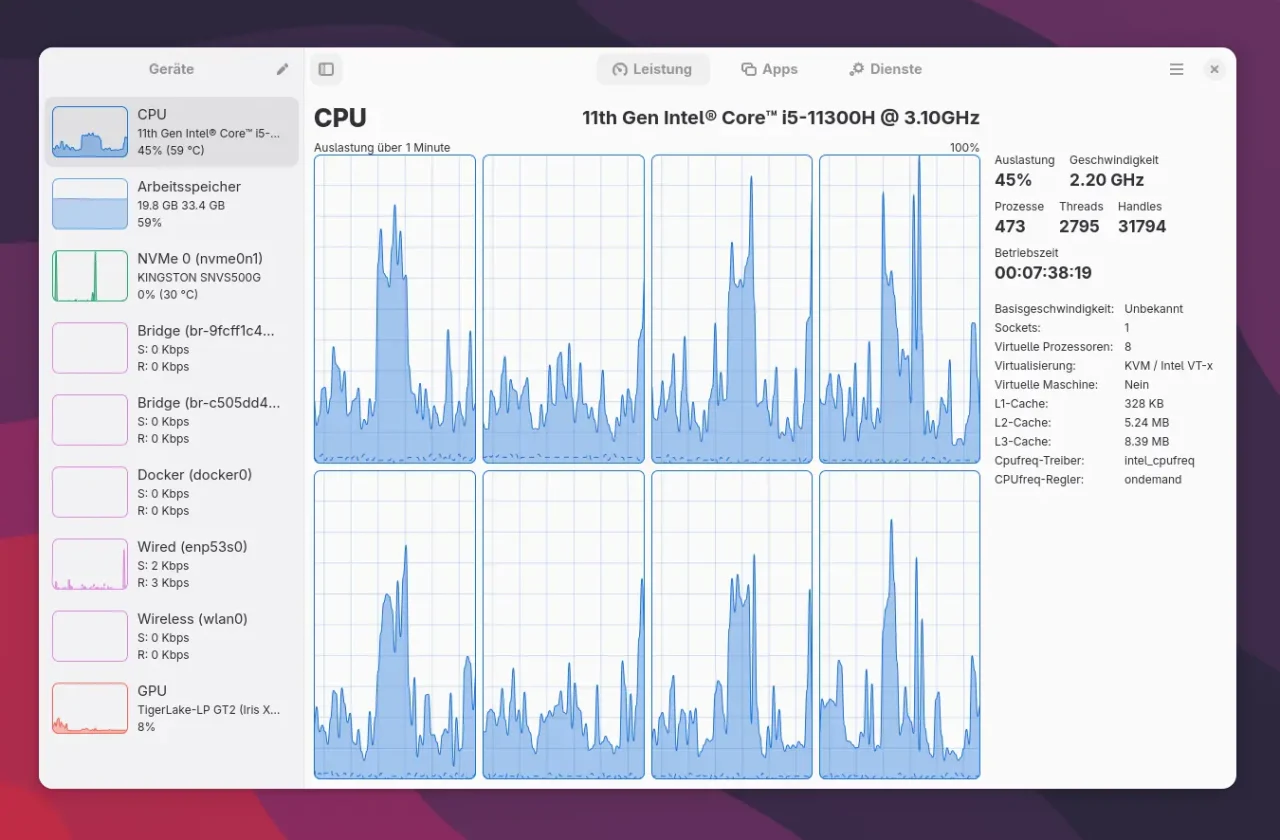
If you don’t know Mission Center yet: the app lets you monitor various system resources such as CPU, RAM, drives, network, and GPU in real time. It scores with a slick interface built on GTK4 and Libadwaita, which makes it a perfect fit for current GNOME desktops. What I like most is the focus on clarity and performance: all graphs are rendered with hardware acceleration, which keeps the CPU load low.
A few highlights of the basic features:
- Monitoring CPU usage per core or thread
- RAM and swap usage, including memory distribution
- Drive and network activity, including interface information
- GPU usage (via NVTOP), including video encoding/decoding
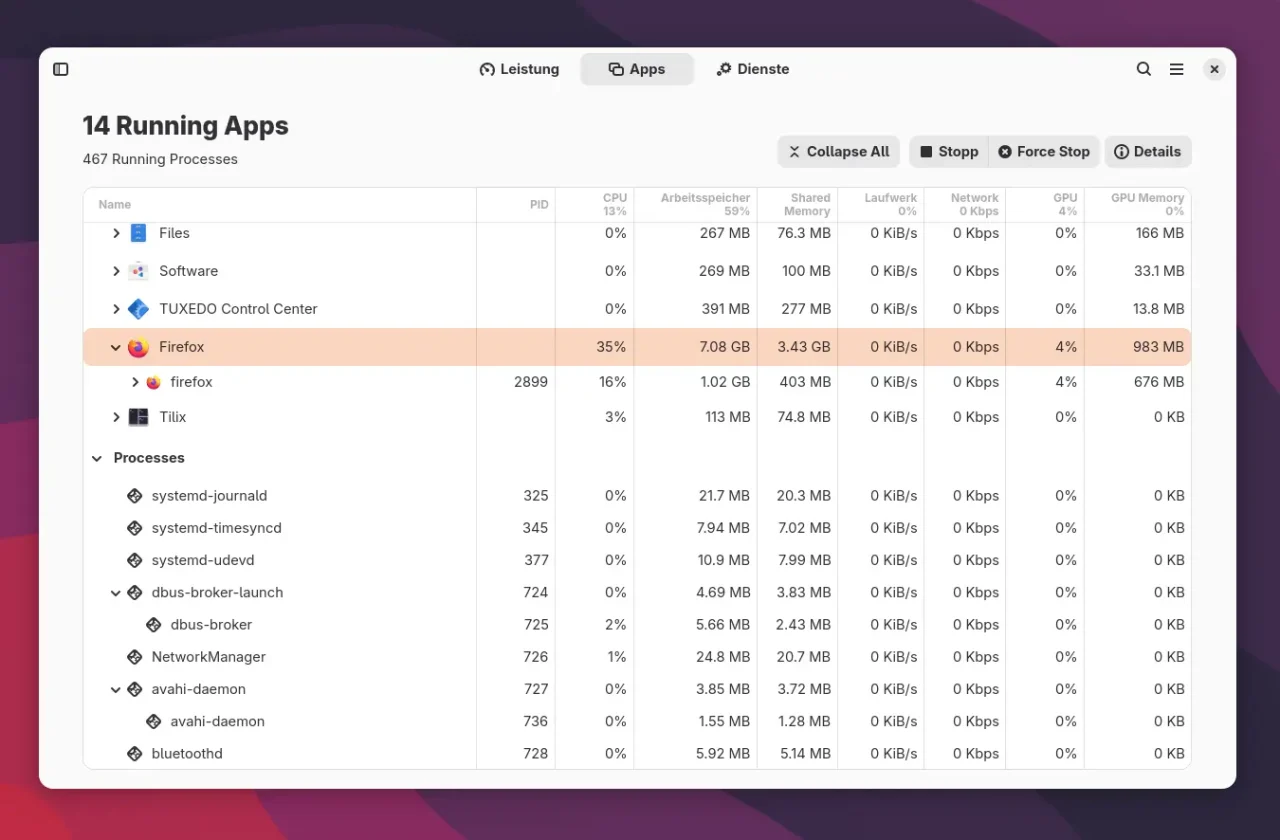
- Display of running processes and their resource consumption
- A compact summary view for a reduced layout
What’s new in version 1.0?
With the 1.0 release, Mission Center gets more than a nice round version number. It also brings a lot of useful improvements. The most important one: the app has become noticeably more responsive, and it now updates its displays much more precisely in time.
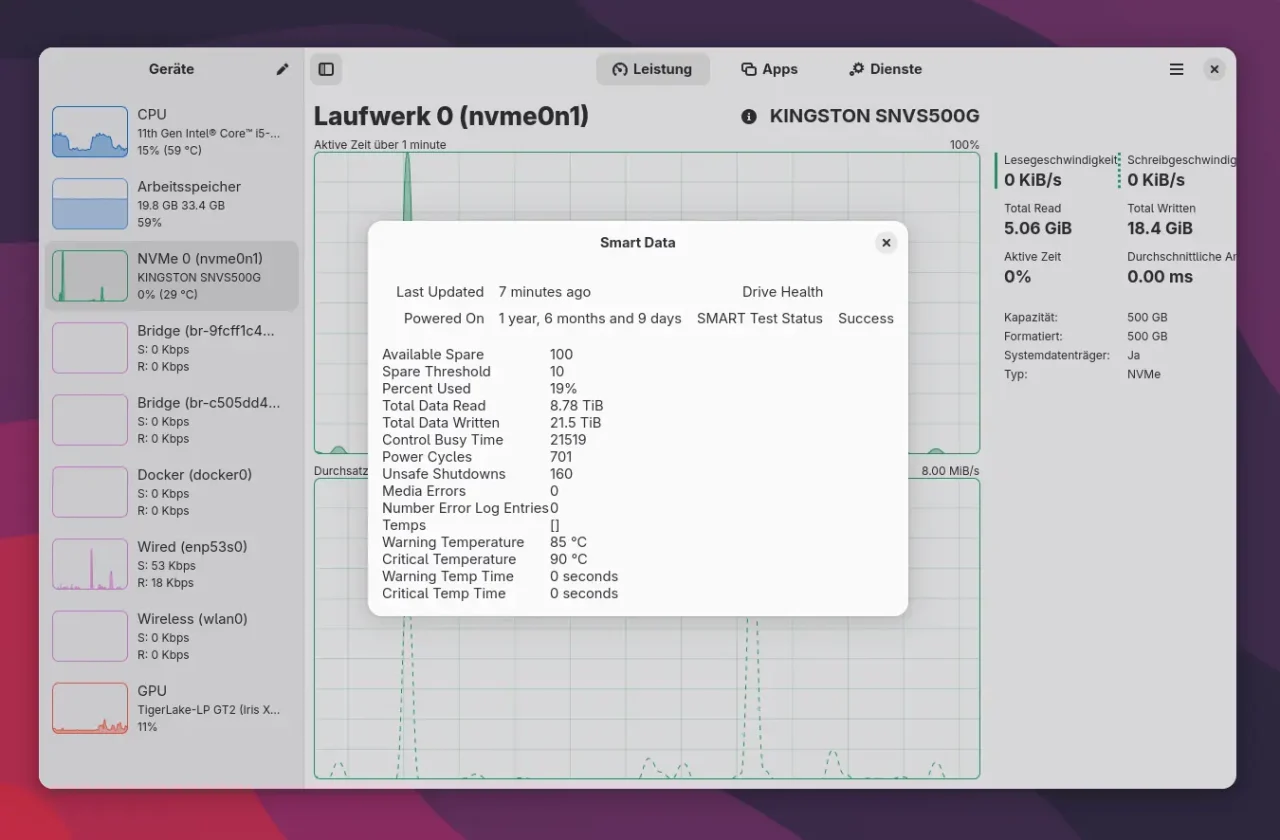
SMART data thanks to UDisks integration
Mission Center 1.0 now uses the widespread UDisks backend to give you detailed information about your hard drives and SSDs. If your drives support SMART (Self-Monitoring, Analysis and Reporting Technology), which is standard on current SATA and NVMe devices, you’ll see things like:
- Temperature
- Power-on time
- Error statistics
- and more
You can also eject drives directly, with a helpful error message if something goes wrong. This integration moves the storage view inside the app a big step forward and gives it a bit of added value over other system monitoring tools.
Network usage per process
At last, you can see which process causes how much network traffic. This feature requires nethogs to be installed, though. On Arch Linux, for example, you get it with:
$ <strong>sudo pacman -S nethogs</strong>
$ <strong>sudo setcap cap_net_admin,cap_net_raw,cap_dac_read_search,cap_sys_ptrace+pe $(which nethogs)</strong>
$ <strong>getcap $(which nethogs)</strong>
After that, the Processes view shows a new column for network activity, sortable, of course. In the current version 1.0, the translation for this column is still missing.
GPU monitoring on the Raspberry Pi
Owners of a Raspberry Pi 4 or 5 can look forward to this: the GPU is now detected and monitored via NVTOP, provided the right kernel is installed. That means at least kernel 6.12 with the corresponding support, for example in current Arch or Manjaro builds for the Pi.
Light or dark? You decide!
Not everyone likes the system-wide dark mode, or maybe you want to work in light mode during the day and dark in the evening. Mission Center 1.0 now lets you choose between light and dark mode independently of the system setting.
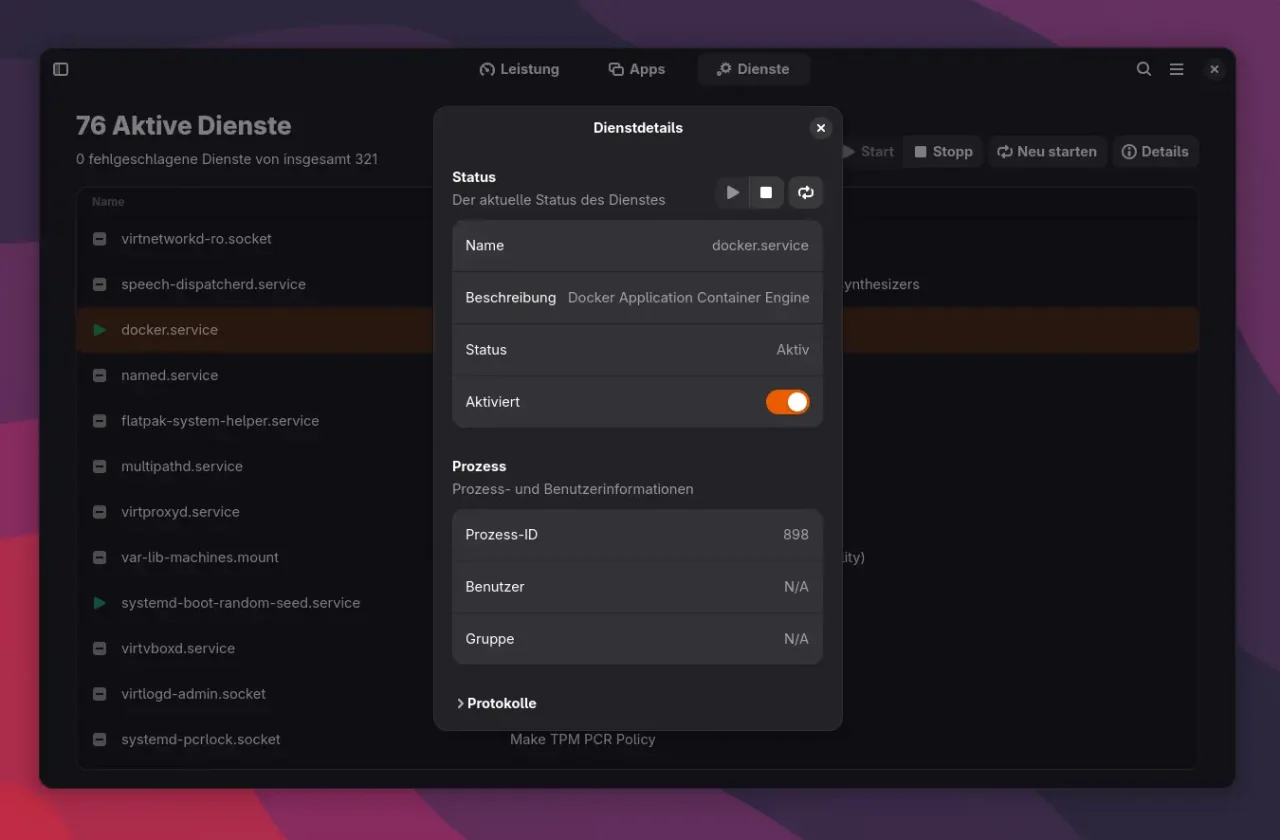
There’s also a new option to make the graphs “glide” with an animation. It looks pretty, but it comes with a certain performance tradeoff. On weaker systems (Mission Center also runs on a Raspberry Pi, for example) you may be better off disabling it.
Other changes at a glance
- Display of unloaded services on the Services page
- Improved memory reporting
- Display of the maximum bitrate of all network interfaces
- Configurable units: bits vs. bytes, base 2 vs. base 10
- More keyboard shortcuts
- New arrangement of the sidebars for a better overview
- Reworked Apps and Processes page with more information
Installing Mission Center
Mission Center is free software and available for various Linux distributions. The easiest and recommended way to install it is Flatpak via Flathub:
$ <strong>flatpak install flathub io.missioncenter.MissionCenter</strong>After that, you can open the app from the app launcher or straight from the terminal with:
$ <strong>flatpak run io.missioncenter.MissionCenter</strong>If you use GNOME Software, for example, you can of course also install the Flatpak on your system with a mouse click. Alternatively, you have these options:
- Snap Store: for users of Snap-based systems like Ubuntu
- AppImage: portable, no installation required
The source code is open and freely available on the project page on GitLab.
A good alternative to System Monitor
Of course, there are plenty of monitoring tools on Linux: htop or glances in the terminal, GNOME System Monitor, or the new Resources, to name just a few. But Mission Center stands out for me with its combination of a modern interface, a sensible range of features, and good performance. The similarity to the Windows Task Manager layout may be divisive, but I think it’s a pragmatic and user-friendly solution. Above all, though, the app is fully open source, actively developed, and fits perfectly into the modern GNOME desktop.
Leave a Reply