
If you work in GNOME and want to know how busy your machine is at any given moment, TopHat and Statistig are two useful extensions. Both show the important system data right in the panel, with no separate windows and no extra programs to start. The differences are mostly in the level of detail. I took a look at both extensions and will show you who should pick which one, and where to find alternatives if you prefer a standalone app.
Statistig: Minimalist and well integrated
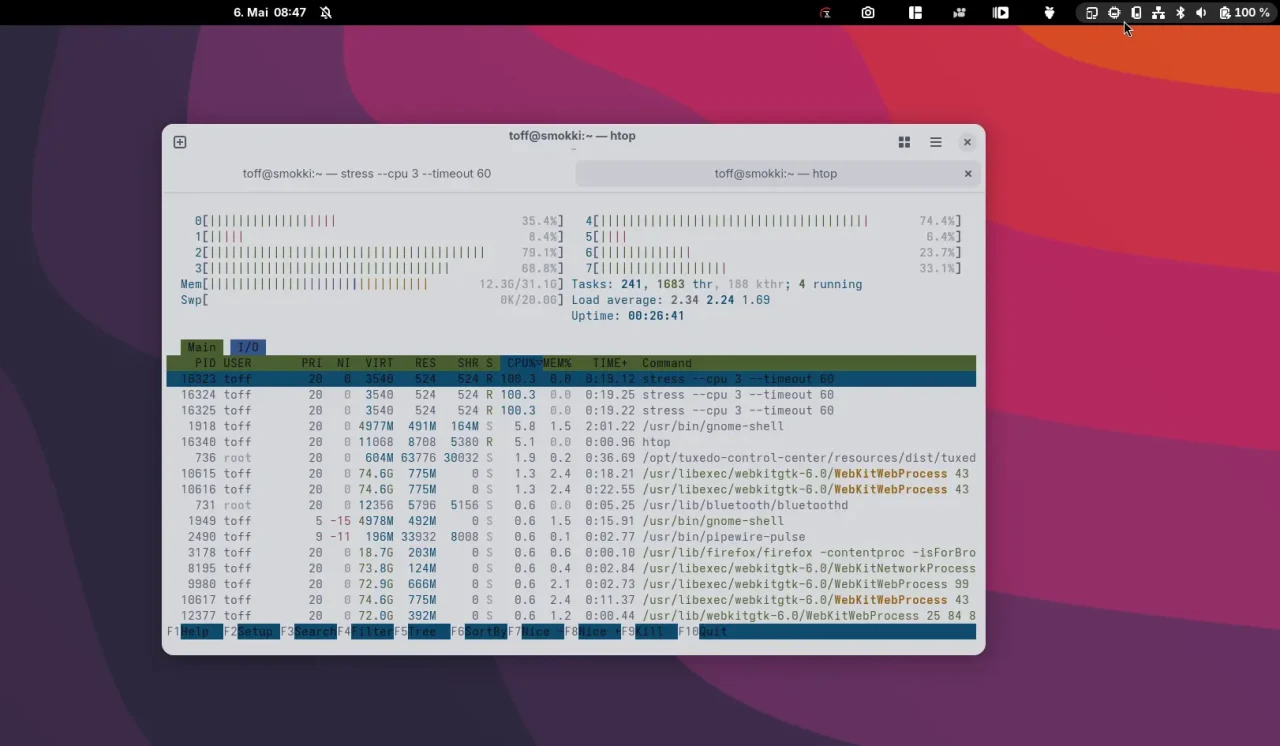
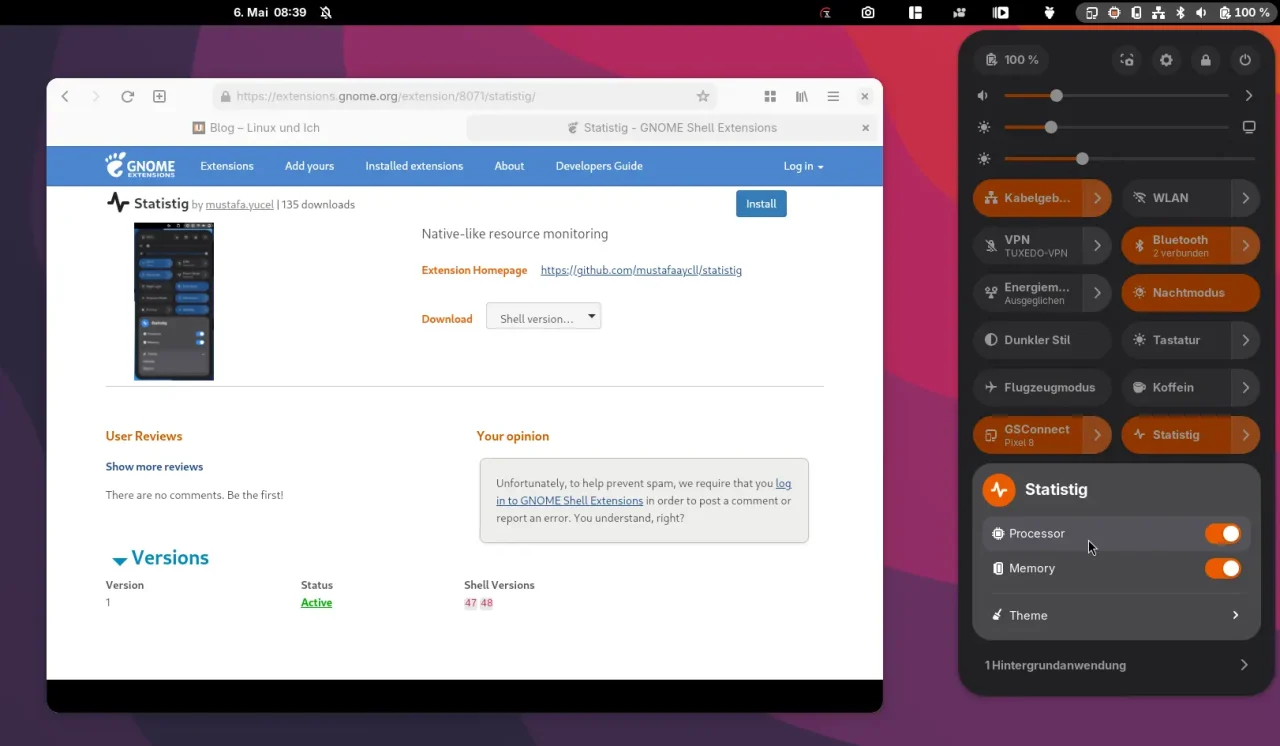
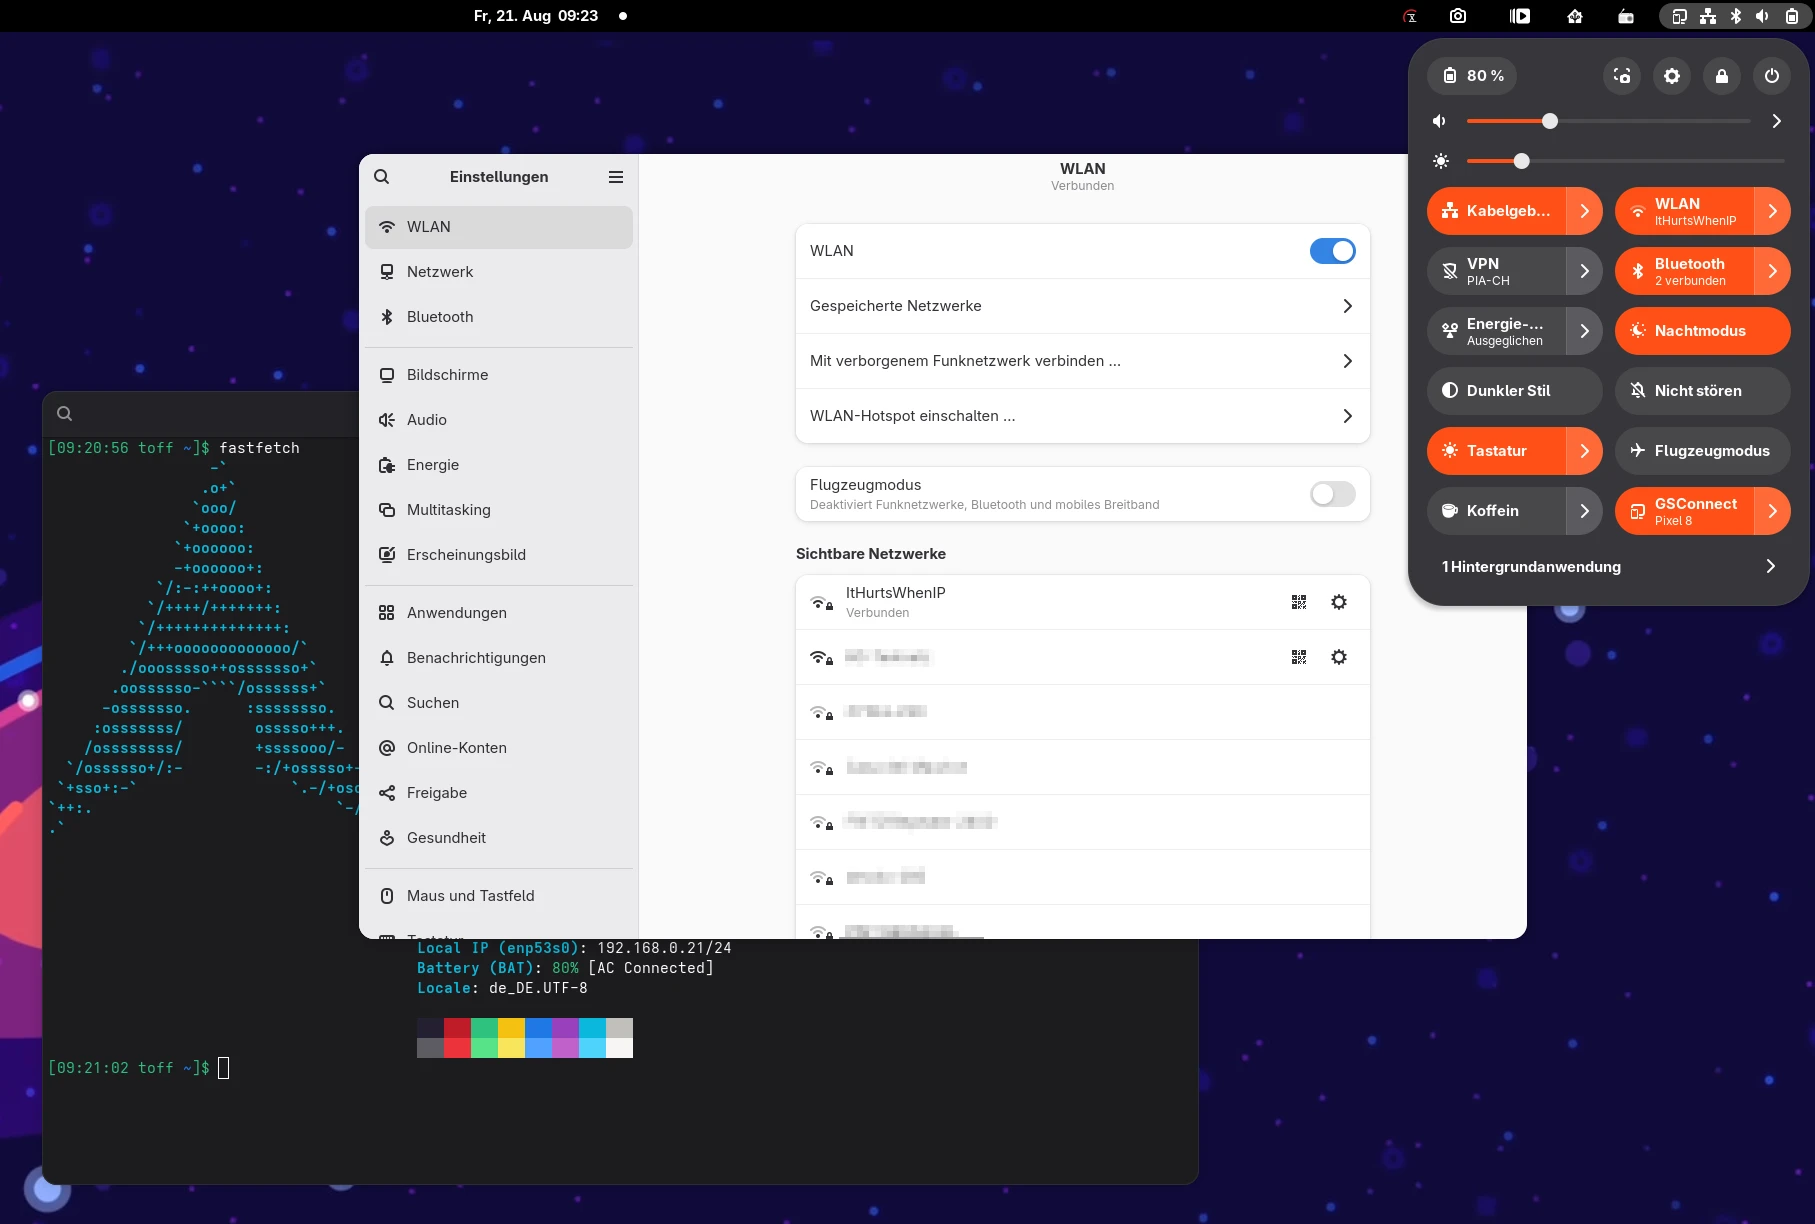
Statistig (the link goes to GNOME Extensions) is a lean system monitor that shows CPU and RAM usage as small icons in the system status area, right where you also see volume, network, or battery. The display stays discreet and is color-coded: yellow from 70% usage, red from 90%. That way you can see at a glance whether your system is starting to sweat.
The design follows the GNOME guidelines and deliberately skips any graphical ballast. One small downer: Statistig also hooks into the system menu. That wouldn’t be necessary, since settings can easily be changed in the extension manager. It’s not really annoying, but it feels a bit superfluous. The source code is available on GitHub.
TopHat: More data, more overview
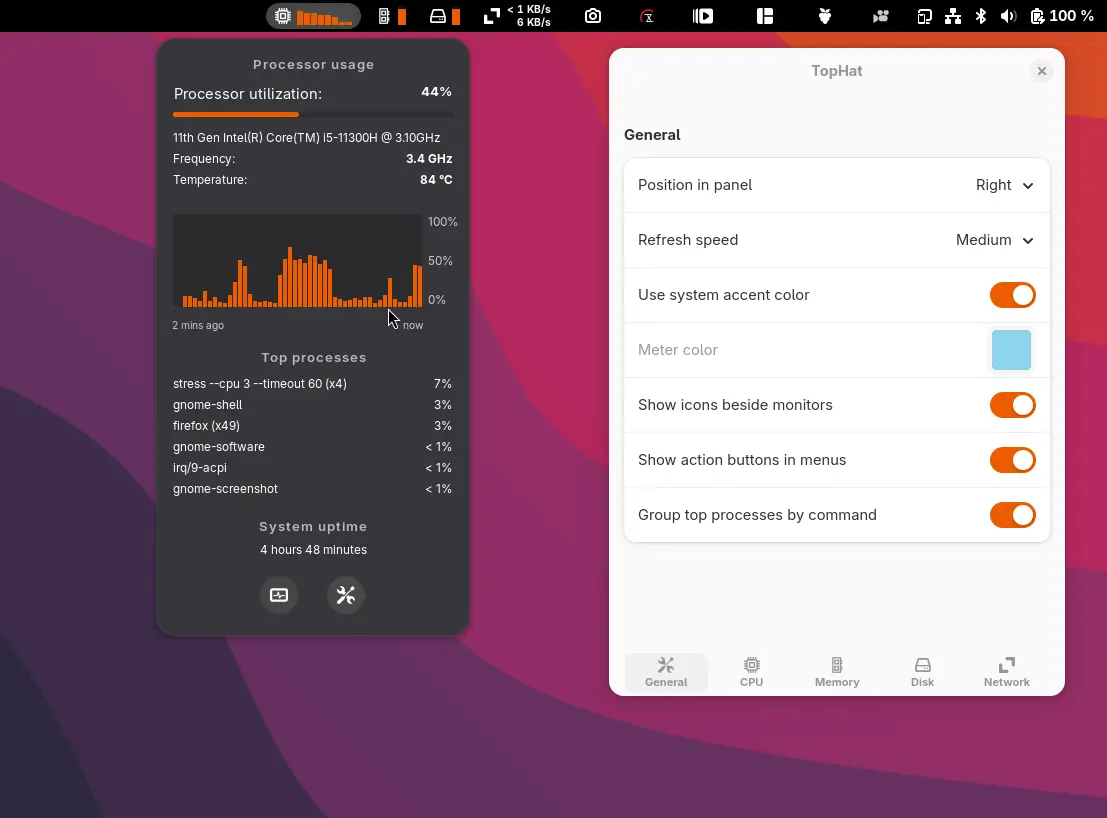
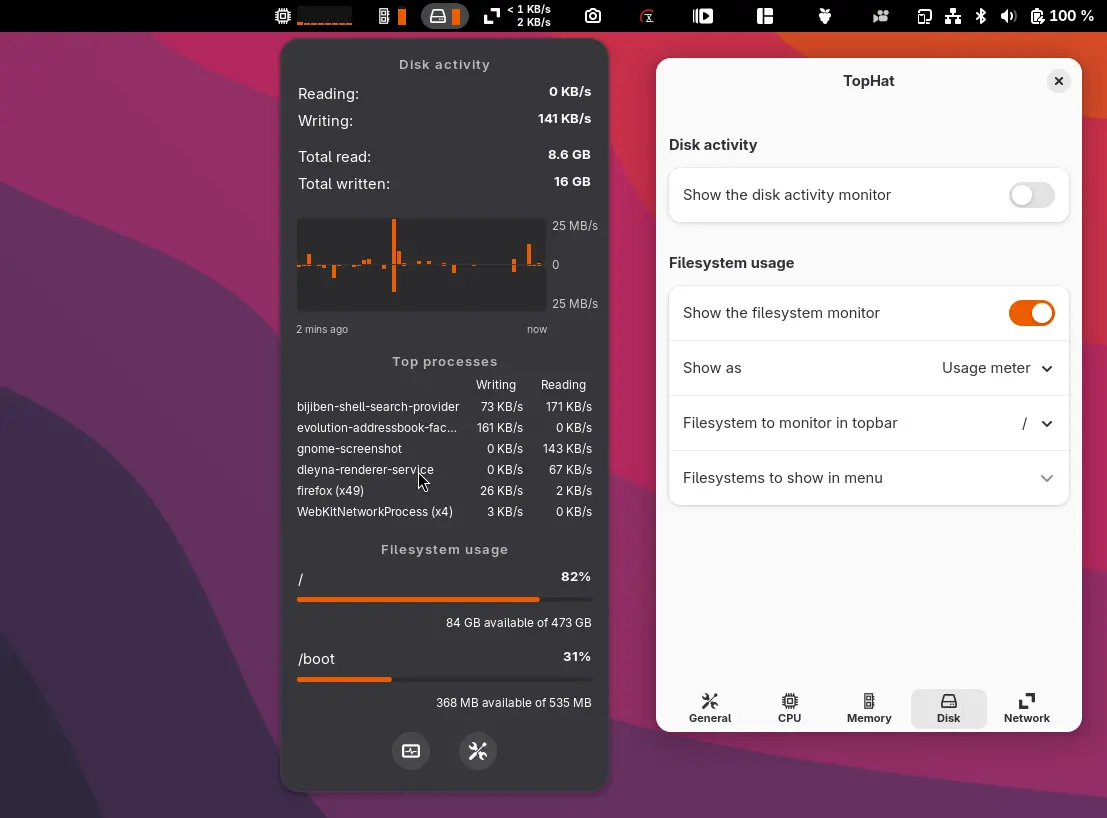
TopHat (the link goes to GNOME Extensions) is aimed at everyone who appreciates a bit more control and transparency. Besides CPU and RAM usage, the extension also shows network and disk activity, right in the GNOME top bar, with small animated graphs. It all stays clear and doesn’t clutter the desktop visually.
TopHat is helpful if you regularly want to figure out why the system feels sluggish right now or where the network traffic is going. The graphs are compact but informative, and they give you a lot more context than plain percentages. If you want to dig deeper, TopHat is a good choice. Here, too, the source code is on GitHub.
If you want more: Mission Center
If you prefer a classic app over a Shell extension, take a look at Mission Center. The app was recently released in version 1.0 and is built on GTK4 and Libadwaita, so it looks modern and is functionally comprehensive. You see processes, CPU cores, memory, network, and more, all in one clear window.
Mission Center is best when you want to systematically hunt for bottlenecks or unusual behavior. Unlike the extensions, it needs an open window for that, but it offers more depth in return. If you regularly analyze your system, this is a strong tool.
Which monitor is right for you?
Whether Statistig, TopHat, or Mission Center, all three tools have their place. Statistig is ideal if you prefer a minimalist display and just want to keep an eye on whether the computer is under load. TopHat goes a step further and offers additional insight without disturbing the slim GNOME desktop. And if you’re looking for a full-fledged system monitor as a standalone app, Mission Center is a modern alternative. Looking back: whatever happened to Conky? Do you still have the classic running?
Leave a Reply